Ian McIsaac
Financial Training and Consultancy
| Home | Services | Learning Centre | Course Schedule | Clients | CV | Contact |
Back to main menu
4 |
FINANCIAL ANALYSIS |
|
4.1 |
Overview |
|
| Financial analysis is both art and science, requiring professional
judgement and an understanding of a company’s business and strategy.
It forms only one part of a comprehensive analysis of a company and
should contribute towards, and benefit from, the assessment covering
the non-financial aspects of the business. Ratios provide a relatively simple means of examining the financial health of a business. However, ratio analysis – by itself – is incomplete. A product of any analysis of financial statements should be a list of questions for the financial management of the company. Financial analysis involves an understanding of each of the three basic and important financial statements: balance sheets, profit and loss statements and cash flow statements. Each statement is an indicator of three critical dimensions of performance: balance sheet strength (liquidity, leverage), operating performance and cashflow strength. Balance Sheet strength Leverage: The balance of debt and equity for long run risk/return
tradeoffs. |
||
4.2 |
Financial Ratios |
|
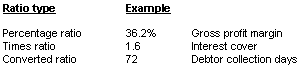
| There are different types of ratios and we need to be familiar with them. Here are examples of some that are used regularly: | ||
 |
||
| The ratio-type terminology is not in itself important, as long as we understand that there are different ways of showing a ratio and that we can interpret what it is telling us. | ||
4.2.1 |
Ratio Comparisons |
|
| Ratios are a method of summarising and presenting financial information
in an easily understandable form. We can use them to assist in assessing
the performance of a business by identifying relationships between
different figures which we consider to be significant. The use of
ratios is valuable to us not necessarily because they provide answers
but because they help to focus our attention on the important areas
at question. Therefore there is less likelihood of us failing to identify
a significant trend or weakness. In isolation a ratio is of limited value. They must always be considered relative to each other and also relative to whatever other information is available about the company, its strategy and the market place. There are two comparisons that can be carried out. a) Historic This is where we need to compare the company against its own past record. Ratios can be used to assess previous performance by looking at trends over a number of periods (this involves looking at the ratios horizontally). Such an exercise will give us a good idea of what is changing, or indeed not changing. To ensure meaningful analysis of ratios, a minimum of three years financial information is required. b) Industry We can carry out a peer group analysis i.e. information we can
obtain about the industry. Certain ratios can be “standard”
across an industry. However, if you are comparing different business
within the same industry, take care to think about: There is one further comparison which we have not yet mentioned
and that is the vertical comparison i.e. if one ratio is increasing
what impact can this have on another ratio? It is important to understand
the impact that a change in one ratio has on another. If there are
contradictory movements in related ratios, this should lead you
to question and to investigate why, to understand how the risk in
the business is changing. • the net profit margin If the reverse was the case, it could mean higher contribution from sales to cover overheads leading to an improvement in the net profit margin and perhaps a decrease in borrowing. Conclusion |
||
4.3 |
Ratio Analysis |
|
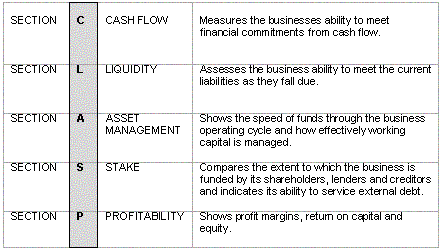
| When using ratios we should view them both horizontally – trends from period to period – and vertically. Vertical comparisons can be ‘split’ into distinct ‘groupings’ as detailed below. | ||
 |
||
| The relationship between the ratios in these five ‘groups’ can be of invaluable help in analysing a business. | ||
4.3.1 |
Section C - Cashflow |
|
| Cash flow is the lifeblood of any business. Therefore we begin our
structured analysis with cash flow ratios. The ratios should of course
be read in conjunction with the full cash flow statement.
• A broad measure of the business’s ability to meet all of its short-term financial obligations from core cash flow.
• Indicates the ability to service total interest commitments
from cash generated from operations. |
||
4.3.2 |
Section L – Liquidity |
|
| Liquidity has an immediate bearing on the financial profile of a
business and therefore its ability to survive. A business that cannot
turn its current assets into cash runs the risk of failing. It is
essential therefore that when we look at a business, that they are
appropriate i.e. long-term facilities are used for longer term/fixed
assets, and short-term facilities for working capital. This should
ensure an acceptable structure to the balance sheet and mean that
the business should have sufficient cash to ensure the servicing and
repayment of its short-term debts.
• The number of times the business’s short term assets cover its short term liabilities i.e. a measure of the business’s ability to meet its day to day commitments. • Technically if the ratio falls below 1.1 then the business is illiquid, although the trading practice within the industry may make this acceptable (e.g. food retailers) and comparison needs to be made with others in the same industry. It is essential when analysing this ratio to look at a number of
factors such as the nature of the business, the quality of the assets
and the seasonality of its trading. Although the current ratio is a banker’s traditional favourite, it is unfortunately one of the worst for predicting failure.
• A more conservative ratio than the current ratio as it
removes stock and W.I.P., which reflects the assumption that these
items will often take longer to convert to cash than the other current
assets. |
||
4.3.3 |
Section A – Asset Management |
|
| This section is concerned with how effectively the assets of the
business are being used. Many of the ratios relate to the working
capital of the business i.e. – stock, (raw materials, W.I.P.
and finished goods) trade debtors and trade creditors. It complements
the liquidity measures and helps us to understand movements in some
of the component parts of liquidity.
• A broad measure of asset efficiency. A ratio of 1.2 means
that the business generates £1.20 of sales for each pound
invested in assets.
• One of the so-called activity ratios that measures the average time in days that it takes to collect payment from debtors and hence indicates the ability of management in controlling/collecting payments from trade debtors – compare with terms of trade and industry norms if these are available. An increase in the ratio is generally a poor sign and could signify: • Selling to larger, financially stronger customers who demand/take
longer periods of credit.
• Indicates the efficiency of stock control. All fluctuations need to be investigated:
• Indicates the length of credit in days taken from suppliers
and extent therefore of reliance on creditors – compare with
terms of trade and industry norms. N.B. If cost of sales includes a substantial portion of non-supplier element – i.e. direct labour, machinery costs etc. the ratios will be distorted although still revealing a trend period on period (providing make up of cost of goods remains the same).
NWA includes only those current assets and current liabilities that vary in direct proportion to sales turnover assuming the terms of trade and stock-holding policy remain the same. It is a useful measure of the amount of money that is tied up in funding the day-to-day trading activities of the business.
• Provides a measure of the business’ efficiency in
employing working capital to generate sales. |
||
4.3.4 |
Section S – Stake |
|
• Indicates the capital sufficiency or insufficiency of the
business. Increases in the ratio could be caused by: • Losses – reducing capital resources 
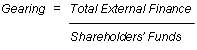
• Indicates the extent to which a business relies on all
liabilities compared to shareholders funds. - If gearing is increasing whilst leverage remains static (or reducing)
then external finance (borrowing) is taking the place of other creditors
– if the reverse movement is seen, then there is more reliance
on other creditors. 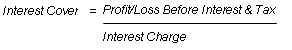
• Indicates the extent to which a business is generating
profit to meet its interest commitments.
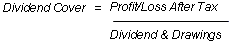
• Indicates the number of times the profit after tax covers
the company’s declared dividend or drawings. |
||
4.3.5 |
Section P – Profitability |
|

• Reasonable sales growth is normally “a good thing”.
It indicates an increasing market share or an expanding market or
both.
• Any material changes in this ratio must be questioned,
as this ratio provides the measure of profitability of the core
business of the business. A measure of success in the marketplace. - Increased efficiency
• This ratio provides a further measure of the efficiency
of the business.
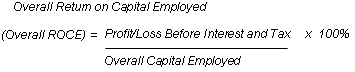
• This ratio measures the return on all capital employed
(including long-term debt as well as equity) against all net income
(core and non-core business) before tax and interest.
• A comprehensive measure of a company’s performance,
especially from an equity investor’s perspective. 
• A further comprehensive ratio measurement which measures the return on the total assets being used by the business . Some analysts place too much reliance on ratio analysis. Empirical studies such as those conducted by Professor Beaver demonstrate that such ratios are not reliable predictors of failure. Professor Altman invented the Z-Score – a weighted composite of financial ratios, but though a better predictor of failure than many individual ratios, it still could not achieve the 99% reliability required by the banker. |
||
| Back to main menu |