Ian McIsaac
Financial Training and Consultancy
| Home | Services | Learning Centre | Course Schedule | Clients | CV | Contact |
4 |
FINANCIAL ANALYSIS |
|
4.4 |
Break-Even Analysis |
|
| Break-even Analysis is concerned with the profit and cost structure
of a company and how these relate to the level of activity in the
business. It is a useful tool for the analyst to quantify the risks
under various business alternatives and to measure the prospective
results of management’s short-term decisions. Break-even is defined as the point, or revenue level, at which losses cease and profits begin. Profit, simply put, is the difference between revenue and total costs: Revenue = Costs + Profit (R=C+P) We can break this down further by recognizing that all costs do
not change at the same rate and in the same way. The cost of an
increase in productive labour, for example, has no effect on the
depreciation cost of a machine, or on the rent paid for the building.
However, volume of production (or revenue) is one of the usual causal
factors in changing productive labour costs (more revenue may mean
you must hire additional staff). The depreciation expense and the
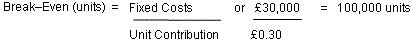
rent cost, on the other hand, are fixed with time. Revenue = Variable Costs + Fixed Costs + Profits (R=VC+FC+P) Let us suppose that, in a business producing pots, 70%, or £0.70, out of every sales pound represents the variable cost. Fixed costs are £30,000. £0.30 pence (£1.00 - .70 = .30) out of every sales pound will be left over to contribute to the coverage of the fixed costs and profit. It follows that the number of units that must be sold to break-even would be:
Clearly, any pots sold above the break-even level would mean that
the “contribution” would all go to profit, since the
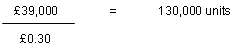
fixed costs were already covered. This means the company must sell an additional 30,000 pots (130,000
– 100,000) to reach the break-even point and begin making
a profit again. So what’s the decision? Well, the manager
would have to feel that the additional money spent on promotion
would indeed generate more than just 30,000 units before it would
be a wise move. |
||
Back to main menu |