
Ian McIsaac
Financial Training and Consultancy
| Home | Services | Learning Centre | Course Schedule | Clients | CV | Contact |
Back to main menu
3 |
The Financial Statements in Detail |
|
3.3 |
Cash Flow Statement in Detail |
|
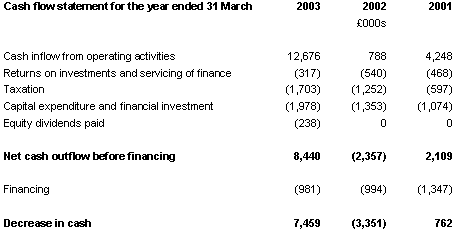
| This statement sets out the cash movements in and out of the company over a financial period. The cash flow statements of the technology company are set out below. | ||
 |
||
3.3.1 |
Explanation of Cash Flow Statement Terms |
|
| Net Cash Inflow from Operating Activities - The
operating profit and the net cash flow from operating activities are
not the same because there are items in the profit and loss which
do not affect cash. A note to the accounts helps us reconcile the
operating profit to the operating cash. This is often to be found
towards the back of the annual report. This reconciliation addresses two key areas where cash and profit differ. The first is non-cash charges. The operating profit in the profit and loss statement is arrived at after making a charge for various non-cash items. The two principal ones are deprecation and amortisation. These non-cash charges are added back as part of the reconciliation. The second is the changes in working capital over the financial period. These include trade debtors, trade creditors and stock. Let us look at trade debtors as an example. We have already said that the profit and loss shows sales made in the year irrespective of whether cash has been received or not. The cash flow, on the other hand, shows the cash received in respect of goods sold. The two are hardly ever the same and it is the changes in trade debtors over the period on the balance sheet that helps explain the difference. If a company is not successful in getting cash in from customers, we would expect to see an increase in amounts owing to the company (i.e. an increase in trade debtors). An extreme example would be an increase in trade debtors from the beginning of the financial period to the end equivalent to the total amount of sales for the year. This would indicate that no cash has come in at all in respect of sales. A more usual outcome, especially for growing companies, is an increase in trade debtors over the financial period in line with the growth in sales. The actual way to determine the cash inflow from sales is to take sales for the financial year on the profit and loss and deduct the amount by which trade debtors have increased over the financial period. Consequently we often see, especially for growing companies, an amount deducted (in brackets) in the reconciliation in respect of debtors. This deduction broadly represents the amount by which trade debtors have increased over the year. Sometimes trade debtors reduce over the year and this will have a favourable effect on the cash flow. A similar adjustment is made in respect of stock, trade creditors and other working capital items. In the way that sales are closely related to trade debtors on the balance sheet, cost of sales is closely related to trade creditors and stock. In the reconciliation there is effectively an adjustment to cost of sales according to whether stock and trade creditors have increased or decreased over the financial period. In the case of the technology company, there is a substantial difference between the operating cash flow (£12.7million) and the operating profit (£6.5million) in 2003. The difference is largely accounted for by adding back the non-cash charges of £1.7 million, a reduction in stocks of £2.3 million on the balance sheet over the year and a reduction in debtors of £2.1 million over the year. Returns on Investments and Servicing of Finance - This shows how much the company has received in cash on its investments and paid out in interest on loans and leases. Taxation - This shows the total amount of corporation tax and overseas tax paid. Once again, because of timing differences, this amount does not correspond exactly to the taxation figure shown on the profit and loss statement. Capital Expenditure and Financial Investment -
This shows the amount spent on the purchase of fixed assets after
deducting any amounts received in respect of asset disposals. Amounts
spent in respect of the purchase of the company’s own shares
will also be shown here. Equity Dividends Paid - This shows the amount of dividends paid during the year. Because of timing differences, this amount does not correspond to the dividend figure shown on the profit and loss statement. Net Cash before Financing - This is the net total of the sections described so far. In the case of the technology company there is sufficient operating cash flow to cover the interest, tax, dividends and capital expenditure. The net cash before financing is £8.4 million. Financing - This shows the cash flows in respect
of the external providers of finance, principally the shareholders
and the banks. There is usually a note in the accounts explaining
the detail. Increase/Decrease in Cash - After taking into
account all the cash inflows and outflows mentioned above, the net
amount will be equal to the change in the cash balance and overdraft
position on the balance sheet since the beginning of the financial
period. There is usually a note which gives the detail of this reconciliation.
It can be very complex, especially for larger companies. |
||
3.3.2 |
What does the cash flow tell us? |
|
| Start by comparing the operating cash flow with the operating profit
on the profit and loss. The add-back of depreciation described above
is often offset by the working capital changes, especially for growing
companies. The result is that operating cash is less than operating
profit. This is by no means an indication of problems, but poor management
of working capital has been the cause of many corporate failures.
Large and sustained increases in stock and debtors on the balance
sheet can be serious for a business, especially for companies that
are growing fast and have slow cash conversion cycles. Look also at the extent to which the operating cash flow is covering the interest paid and also other priority payments such as tax and dividends. The expenditure on purchasing fixed assets and acquisitions is more discretionary and can be cut back in harsh trading conditions. It is usually good to see companies spending an amount on new fixed assets in excess of the depreciation charge. This is an indication that assets are being replenished adequately in order that the business can remain competitive. Many companies do not have sufficient cash after the payment of ‘priority’ items to finance all the new capital expenditure and therefore have to go to the external providers for financing. This is quite normal but we need to be satisfied that the capital expenditure is well-directed in terms of generating future profits and cash flows. Many analysts look at the EBITDA of a business. This is a measure of profit before taking into account the interest payable and receivable, tax, depreciation and amortisation. These last two items are non-cash charges and so EBITDA can be seen as creating an earnings measure closer to cash flow from operations. A high level of EBITDA to interest payable is an indication that the business is not having any difficulty paying its interest costs. The key shortcoming of EBITDA is that it does not take into account the working capital changes mentioned in 3.3.1 and can overstate cash flow in periods of working capital growth. |
||
| Back to main menu |